A wine region map is not a wine list. It is a geography document, and most readers approach it the wrong way — hunting for producers, appellations, tasting cues — when the map is actually trying to tell them about a river, a slope, and a border. The contradiction is that wine writing has trained readers to skip the geography and go straight to the bottle, while the maps themselves refuse that shortcut. Bordeaux is drawn around the Garonne. Burgundy narrows along the Saône. Champagne clings to the Marne. Three readers, three regions, three ways to read the same object correctly.
We drew our first regional print because we kept meeting readers who owned three wine books and could not point to Pauillac on a blank map. That is not a failure of curiosity — it is a failure of the medium. Prose about wine tends to move quickly past the map to the glass. So this article walks in the opposite direction. Imagine three readers holding three of our regional prints, each stuck in a different way. The stuckness is the lesson. Once you know what the map is answering, the region stops being a list of names and becomes a place.
Scenario 1: The Reader Puzzling Over Bordeaux's Two Banks
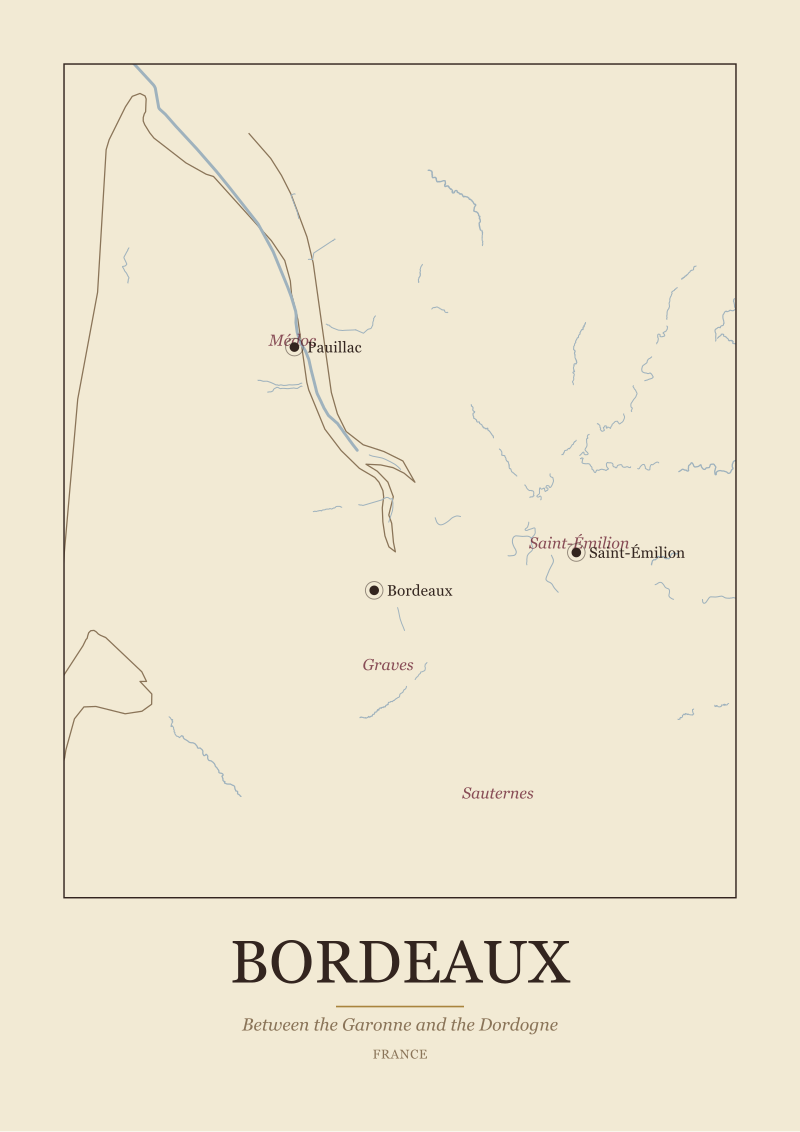
Picture a reader who has just unrolled our Bordeaux print on a kitchen table. They know the words — Médoc, Saint-Émilion, Pauillac, Graves, Sauternes — and they know Bordeaux is famous. What they cannot see is why the map is split into two halves that behave like separate countries. They keep asking the same question in different forms: is Saint-Émilion better than Pauillac, is left better than right, is there a ranking hiding in the geography. There is not. There is a river.
The Garonne is the object the map is drawn around. It rises in the Pyrenees, curves north-west, meets the Dordogne above the city of Bordeaux, and the two rivers braid into the Gironde estuary before reaching the Atlantic. Everything the reader is squinting at sits on one side of that water system or the other. The Médoc, with Pauillac inside it, runs up the left bank of the estuary. Saint-Émilion sits on the right bank of the Dordogne. Graves and Sauternes lie south of the city, still hugging the Garonne. The map is not a hierarchy. It is a hydrography.
Once the reader stops asking which side is better and starts asking what each side is made of, the map begins to speak. The left bank is a long tongue of well-drained gravel deposited by the river over millennia. The right bank has more clay and limestone. Neither of those facts is a marketing claim; they are the reason the appellation borders sit where they sit. A grape that thrives on gravel drainage naturally clustered on one side. A grape that prefers cooler, water-holding soils naturally clustered on the other. The famous towns — Pauillac on the left, Saint-Émilion on the right — are simply the places where those soils are most concentrated and the merchant history is deepest.
The reader should also notice what the map does not show. It does not show a border between the Médoc and Graves that follows a road or a political line. It shows the city of Bordeaux sitting on the Garonne, and the appellations arranged around it like petals around a stem. The estuary is the trunk. The vineyards are the branches. When our print marks Pauillac, it is marking a small town on the left bank of a tidal estuary where the river deposits pushed gravel into unusually deep beds. That is the whole reason Pauillac is a name at all. The map is not asking the reader to memorise producers. It is asking them to notice that Bordeaux is a delta and everything else follows.
Scenario 2: The Reader Squinting at Burgundy's Thin Ribbon
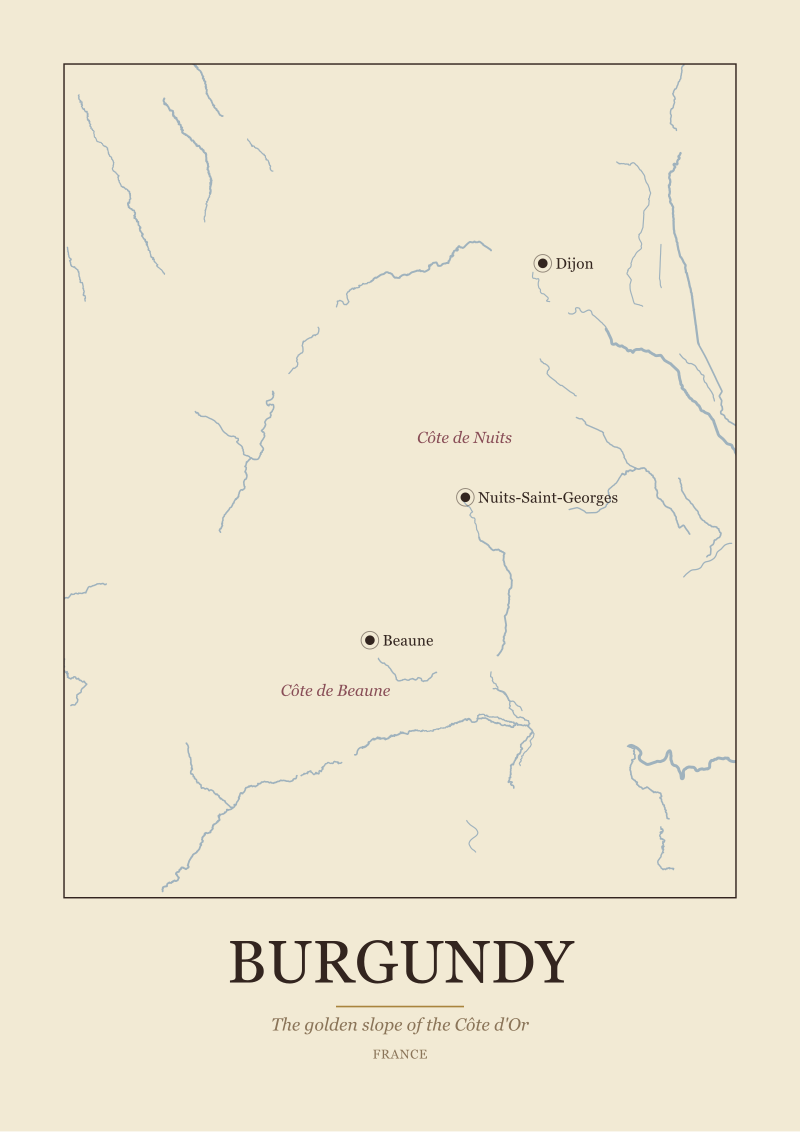
Now picture a second reader, holding our Burgundy print, and confused for the opposite reason. Bordeaux was too wide; Burgundy looks too narrow. The wine world talks about Burgundy as if it were an empire, and the map shows a strip you could almost drive the length of in an afternoon. Dijon at the top, Beaune in the middle, Nuits-Saint-Georges between them, and the whole named heart of the region — the Côte de Nuits above, the Côte de Beaune below — running as a thin ribbon along one side of a valley. The reader wants to know where the rest of it is. There is no rest of it. That is the point.
The valley the ribbon runs along drains into the Saône, the river that gives the region its eastern boundary and its climate. The Saône flows south into the Rhône, and Burgundy's named slope — the Côte d'Or, literally the golden slope — is the east-facing wall on the western side of that valley. Read the map as a topographic document and the ribbon stops being small. It becomes the only strip of ground in this stretch of France that faces the morning sun at the right angle, drains at the right speed, and sits at the right altitude for a grape that ripens reluctantly. Everywhere else on the map is either the flat valley floor to the east or the wooded plateau to the west. Neither works. The ribbon is what is left.
That is why every named village the reader recognises — Nuits-Saint-Georges, Beaune and the smaller places between — appears in a single line. They are strung along the base of the slope like beads on a wire. The wire is the geological fault where the plateau breaks down to the valley. A traveller driving from Dijon to Beaune is driving along that fault. The Côte de Nuits is the upper half of the ribbon; the Côte de Beaune is the lower half. Our print does not draw them as separate colours by accident. The reader who has been searching for a wider region should stop searching. The ribbon is the region. Its narrowness is not a design choice — it is a description of the only ground that works.
The lesson embedded in this map is subtraction. Burgundy is famous because the geography ruled almost everything out. When the reader accepts that, the density of village names along the slope stops looking like clutter and starts looking like a consequence. Each name marks a small commune sitting on its own particular fold of that same east-facing wall. The map is not celebrating abundance. It is documenting scarcity, and the scarcity is why the names matter.
 Bordeaux
The print from this article · from €29.95
View the print →
Bordeaux
The print from this article · from €29.95
View the print →
Scenario 3: The Reader Asking Why Champagne Is So Far North
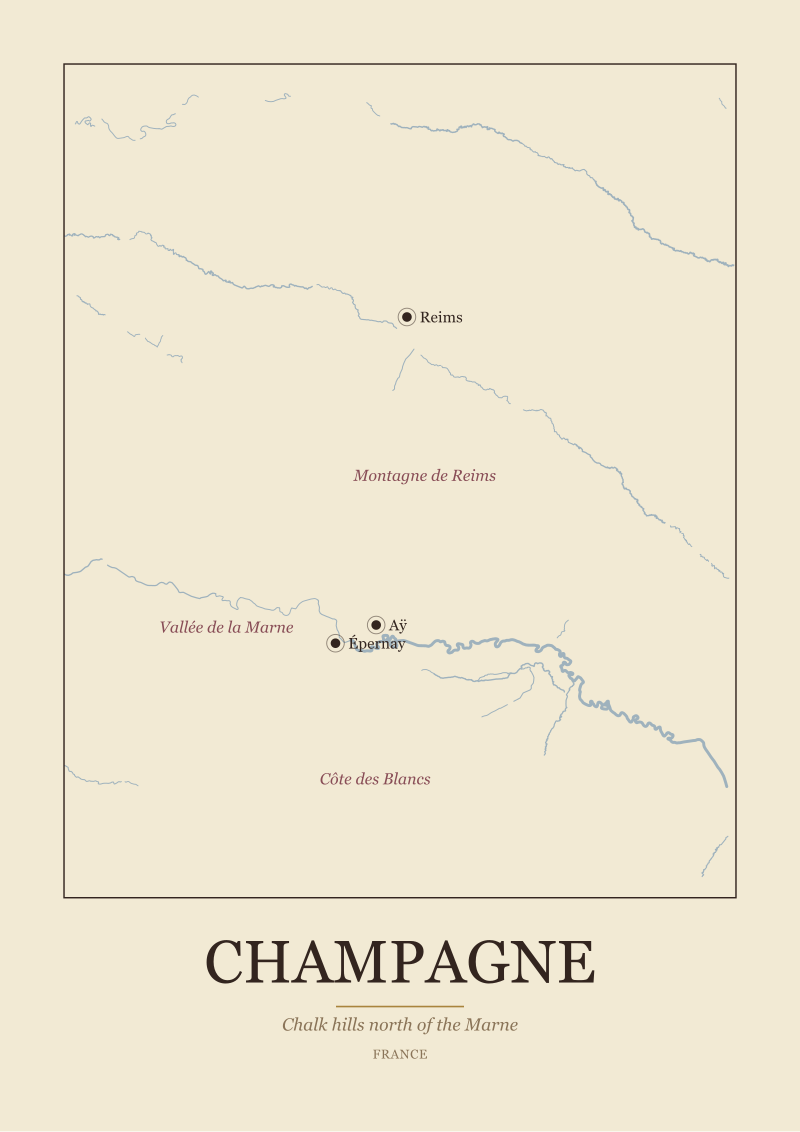
The third reader is holding our Champagne print and asking a colder question. Why is this region here at all. On a map of France, Champagne sits well north of the country's main wine belt, closer to Belgium than to Lyon. Reims and Épernay, the two towns the reader keeps seeing on labels, appear in a landscape that looks — from the map alone — as if it should be growing wheat, not grapes. This is the right question to ask, and the map answers it if the reader looks at what is drawn under the town names.
Two things anchor the region. One is the Marne, the river that runs west to east across the map, passing Épernay and the village of Aÿ. The other is a set of low chalk hills that ring the Marne valley from the north and south. The reader can see these as the crescent shapes of the Montagne de Reims above the river and the Côte des Blancs below it, with the Vallée de la Marne itself running through the middle. Those three names are not marketing; they are the three geographic zones the map is trying to explain. Each is a different slope on the same chalk plateau.
The chalk matters because it does two things at this latitude. It stores warmth from the pale summer sun and releases it slowly at night, extending the ripening window at the margin where ripening would otherwise fail. It also drains cleanly, so the vines do not sit in the winter water that would kill them at this longitude. Take the chalk away and Champagne is too far north to be a wine region. Add the chalk and it becomes the northernmost great wine region in Europe by a comfortable margin. The map is showing the reader the exact limit of ripening in France, and the exact geology that pushes that limit a hundred kilometres further north than it should be.
The town names then arrange themselves logically. Reims sits at the northern edge, at the top of the Montagne. Épernay sits in the valley, on the Marne itself. Aÿ sits on the south-facing slope of the Montagne, above the river. The three of them form a triangle around the ripening zone, and every village the reader has ever heard of on a Champagne label is inside that triangle. The reader who came to the map asking why the region exists this far north should leave the map understanding that it exists at all because of the chalk, and no further north.
What All Three Readers Share
Each of these readers arrived at the map with the same instinct: to treat it as a legend for a bottle. Each got stuck because the map refused. Bordeaux would not resolve into a ranking because it is a river system. Burgundy would not expand into an empire because it is a single east-facing slope. Champagne would not stop existing at the wrong latitude because chalk changes the physics. The common failure is expecting the map to explain the wine. Its actual job is to explain the place, and the wine is the consequence.
The pattern underneath the three scenarios is that every famous European wine region is drawn around a physical feature the reader can identify in fifteen seconds if they know to look. A river, a slope, a soil, a border of climate. Bordeaux is a delta. Burgundy is a fault line. Champagne is a chalk plateau. Once the reader has that first geographic anchor, every appellation name inside the region becomes readable — it is either close to the anchor, on a particular side of it, or at a particular height above it. The producers, the vintages, the flavours are all downstream of that structural fact.
This is also why the maps we draw refuse to double as shopping lists. A map that tried to rank producers would have to lie about the geography to make the ranking coherent. Our prints show the river the way the river actually runs, the slope the way the slope actually faces, the towns the way the towns actually sit. The reader who learns to read that layer will never again mistake a wine region for a brand. They will see the delta, the fault, the chalk.
 Champagne
The print from this article · from €29.95
View the print →
Champagne
The print from this article · from €29.95
View the print →
Which Scenario Is You
If you have been reading wine writing for years and still cannot picture where an appellation sits, you are probably the first reader — you know the names and you are missing the river. Start with a single region, unfold the map, and trace the water. Everything else will hang from it.
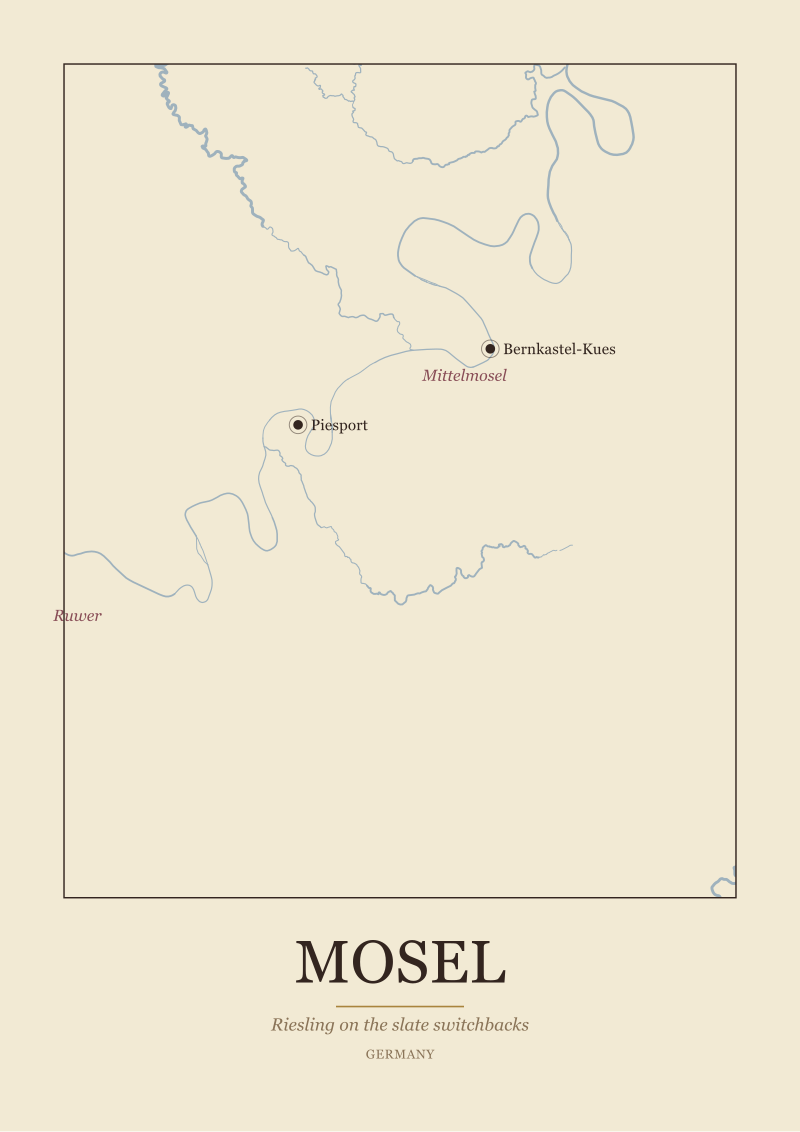
If you already know the geography roughly but the ribbon regions confuse you — Burgundy, the Mosel, the Northern Rhône — you are the second reader. The exercise is to stop expanding and start looking at the slope. The named villages will line up along one wall of a valley, and once you see the wall, the density of names stops being intimidating.
If you find yourself asking why a region exists where it does, why it is that far north or that far east, you are the third reader, and the map is quietly ready to answer. Look under the town names for the geology or the river bend that made the place possible. When you next visit our shop, the print you will want is the one whose geography you can already narrate — the map you can read is the map worth hanging.
FAQ
Why does a wine region map show rivers so prominently?
Because European wine regions were organised around rivers long before appellations were codified. Rivers moderated temperature, carried the wine to market, deposited the soils the vines grew in, and provided the boundaries administrators later formalised. Bordeaux around the Garonne, Burgundy along the Saône valley, Champagne on the Marne — the river is not decoration on the map. It is usually the reason the region exists in the shape it does, and reading it first makes every other detail on the map easier to place.
What is the difference between the Left Bank and the Right Bank in Bordeaux?
The Left Bank and the Right Bank refer to which side of Bordeaux's river system a vineyard sits on. The Médoc, including Pauillac, runs up the left bank of the Gironde estuary and is dominated by gravel soils deposited by the river. Saint-Émilion sits on the right bank of the Dordogne and has more clay and limestone. The distinction is geographic, not hierarchical — different soils suited different grapes historically, which is why the two banks developed as distinct wine cultures.
Why is Burgundy drawn as such a narrow strip?
Because the region's named heart, the Côte d'Or, is a single east-facing slope running along one side of the Saône valley. The Côte de Nuits and Côte de Beaune together form that slope. Everywhere east of it is flat valley floor; everywhere west is wooded plateau. Neither works for the region's traditional grapes. The ribbon on the map is not a stylistic choice — it is the only ground in that stretch of France with the right aspect, drainage and altitude for the vineyards.
Why is Champagne so far north compared to other French wine regions?
Because the chalk under the Marne valley changes what latitude means for grape growing. Chalk stores warmth from a weak northern sun and releases it slowly, extending the ripening window past what the climate alone would allow. It also drains cleanly so the vines survive wet winters. Without the chalk, the region would be too cold. With it, Champagne sits at the northern limit of viable grape ripening in France, which is exactly why the map places it where it does.
What are the main sub-zones of Champagne, and how do they relate to the map?
Champagne has three geographic zones the map makes visible: the Montagne de Reims, a chalk ridge north of the Marne with Reims at its top; the Vallée de la Marne, the river valley itself running through Épernay and Aÿ; and the Côte des Blancs, a south-east-facing chalk slope below the river. Every well-known Champagne village sits inside the triangle those three zones form, all resting on the same chalk plateau.
Are the sub-zones of Alentejo drawn the same way as Bordeaux?
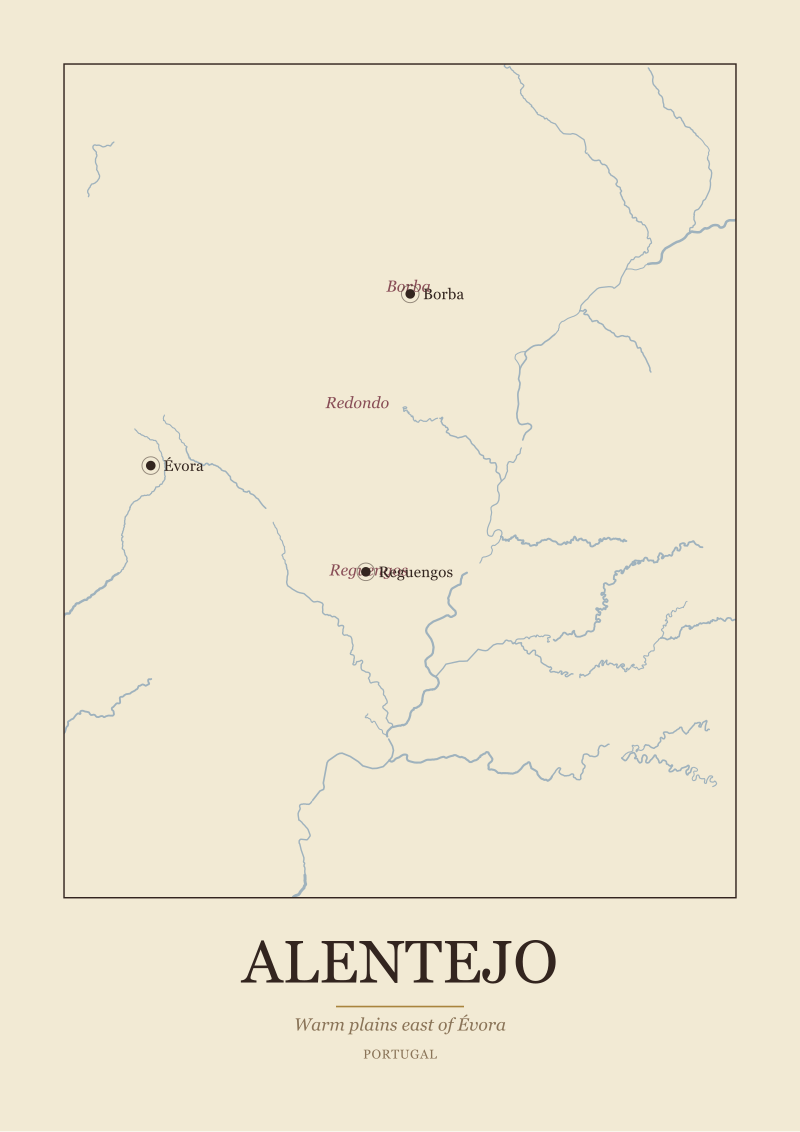
No, and the map shows why. Alentejo, in south-eastern Portugal along the Guadiana, is a region of warm inland plains rather than a river delta. Its named sub-zones — Borba, Redondo, Reguengos — sit east of Évora on that plain, closer to one another than Bordeaux's appellations are. The organising geography is the Guadiana and the heat of the interior, not a tidal estuary. Reading Alentejo's map means reading temperature and elevation, not banks of a river.
Do appellation borders on a map follow rivers, roads or something else?
Appellation borders usually follow a mix of geographic features — the base of a slope, the edge of a soil type, the course of a river — combined with older administrative boundaries between communes. That is why they can look irregular on a map. A border that follows a road is unusual; a border that follows the transition from gravel to clay, or from vine-viable slope to flat valley floor, is common. The irregularity is a sign the border is doing real geographic work.
How should I actually use a wine region map I have on the wall?
Start with the largest physical feature — the river, the estuary, the ridge — and trace it end to end before reading a single town name. Then locate two or three anchor towns along that feature. Only after those are placed should you notice the sub-zones. Used this way, the map becomes a tool for orienting yourself in the region rather than a decorative list of names, and every new region you encounter afterwards will be easier to read the same way.
New regions and 10% off your first print.
One email now with your code. No noise after.